| StockFetcher Forums · Stock Picks and Trading · A Newbie's Journey | << 1 ... 38 39 40 41 42 ... 48 >>Post Follow-up |
| sandjco 648 posts msg #147789 - Ignore sandjco |
5/14/2019 5:13:32 PM Many thanks Xarlor! appreciate it! |
| four 5,087 posts msg #147793 - Ignore four modified |
5/14/2019 11:11:21 PM |
| sandjco 648 posts msg #147795 - Ignore sandjco |
5/15/2019 12:20:34 PM Thank you four! Interesting presentation... What I was trying to do was to: - draw a horizontal line on the volume pane that represented the "outliers" (spikes) over say 1 year and - draw another horizontal line on the volume pane that represented the other spectrum wherein the volume was really low vs what it usually trades at over say 1 year Will most likely close short positions and reverse course to go long SOXL and TECL. My gut said to close these yesterday and reverse course. PIcked up MRVL and GOOG yesterday but will use today's EOD 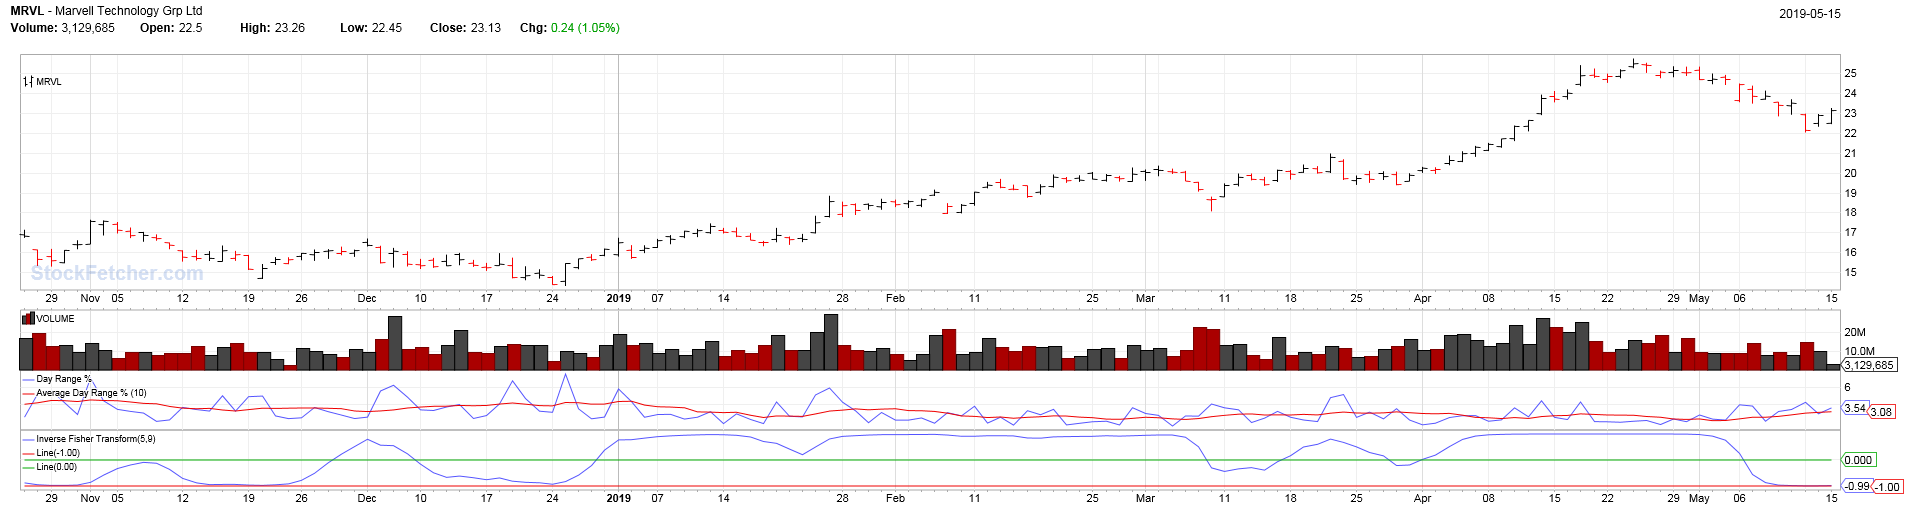 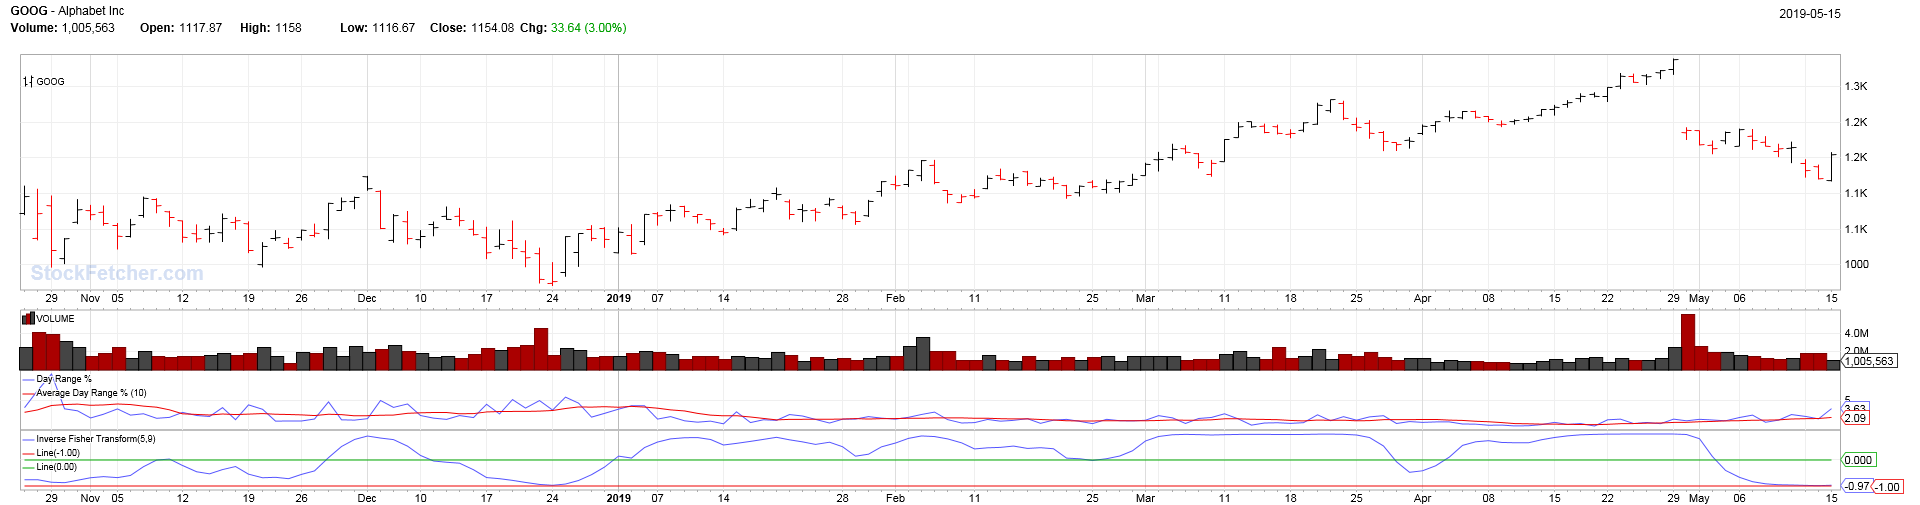  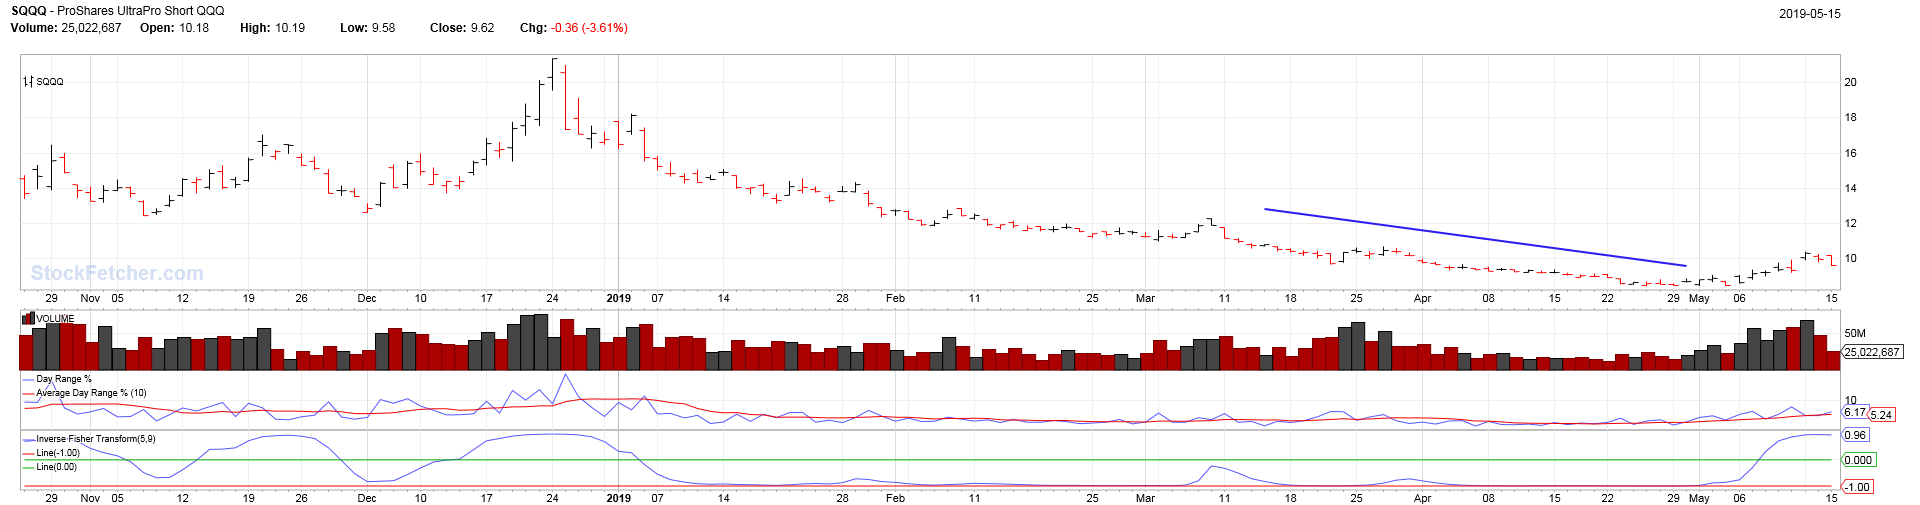 |
| four 5,087 posts msg #147812 - Ignore four |
5/17/2019 12:30:01 AM |
| sandjco 648 posts msg #147829 - Ignore sandjco |
5/18/2019 8:15:44 AM As always, thank you four! Thank you again xarlor for taking the first shot. How do I make the vol 1.5 and vol 2.5 be horizontal lines plotted on vv plot so I will now have 3 horizontal lines on the vv plot? Thank you in advance |
| Village Elder 231 posts msg #147830 - Ignore Village Elder |
5/18/2019 8:38:47 AM Why not use the custom Bollinger Bands? something like |
| sandjco 648 posts msg #147839 - Ignore sandjco |
5/19/2019 9:40:20 AM Thank you Village Elder! Hmmmm....now, how to use the inflection points to trigger either a long or short. |
| sandjco 648 posts msg #147904 - Ignore sandjco |
5/23/2019 5:32:28 PM standing aside; in cash while this gong show persists. Small KRE puts opened. |
| sandjco 648 posts msg #147913 - Ignore sandjco |
5/24/2019 8:29:34 AM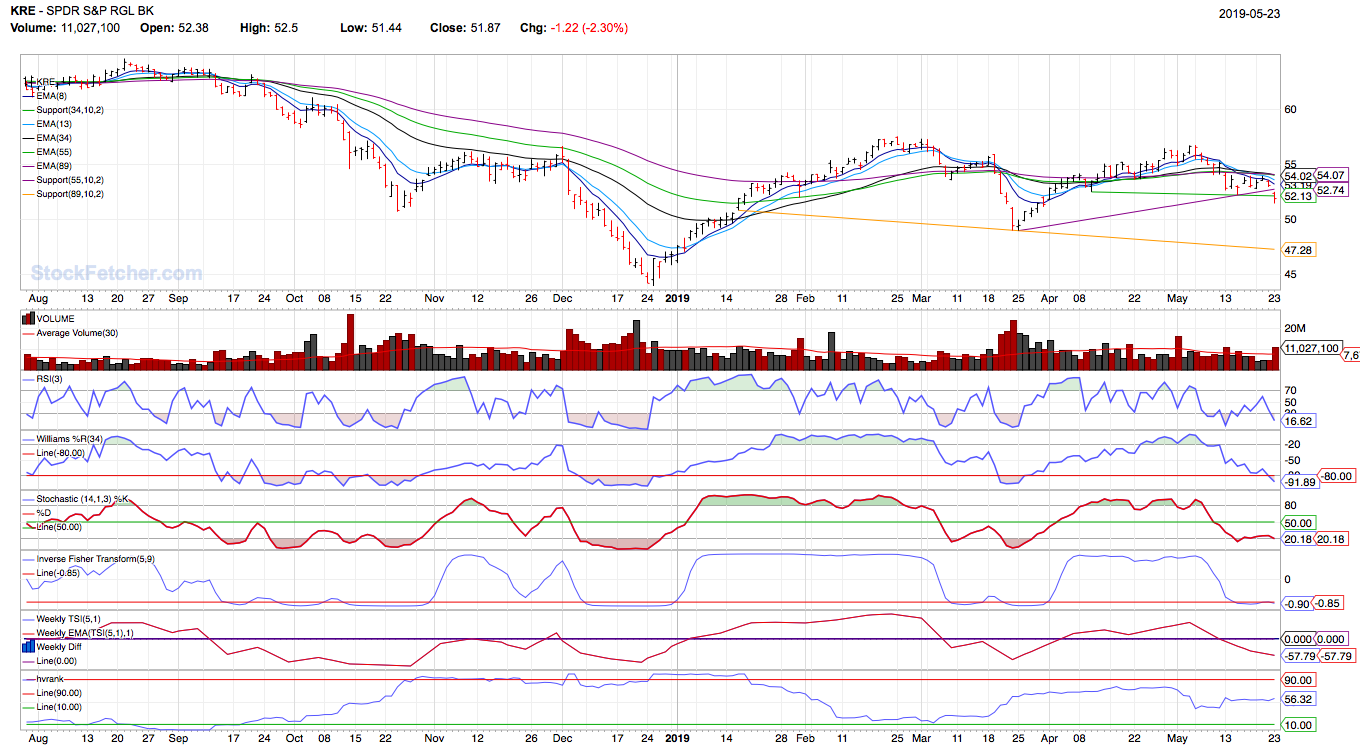 $51.87 MRVL closed using EOD $22.12 loss GOOG closed using EOD $1140.77 loss never followed thru Not a good looking trend to the upside either 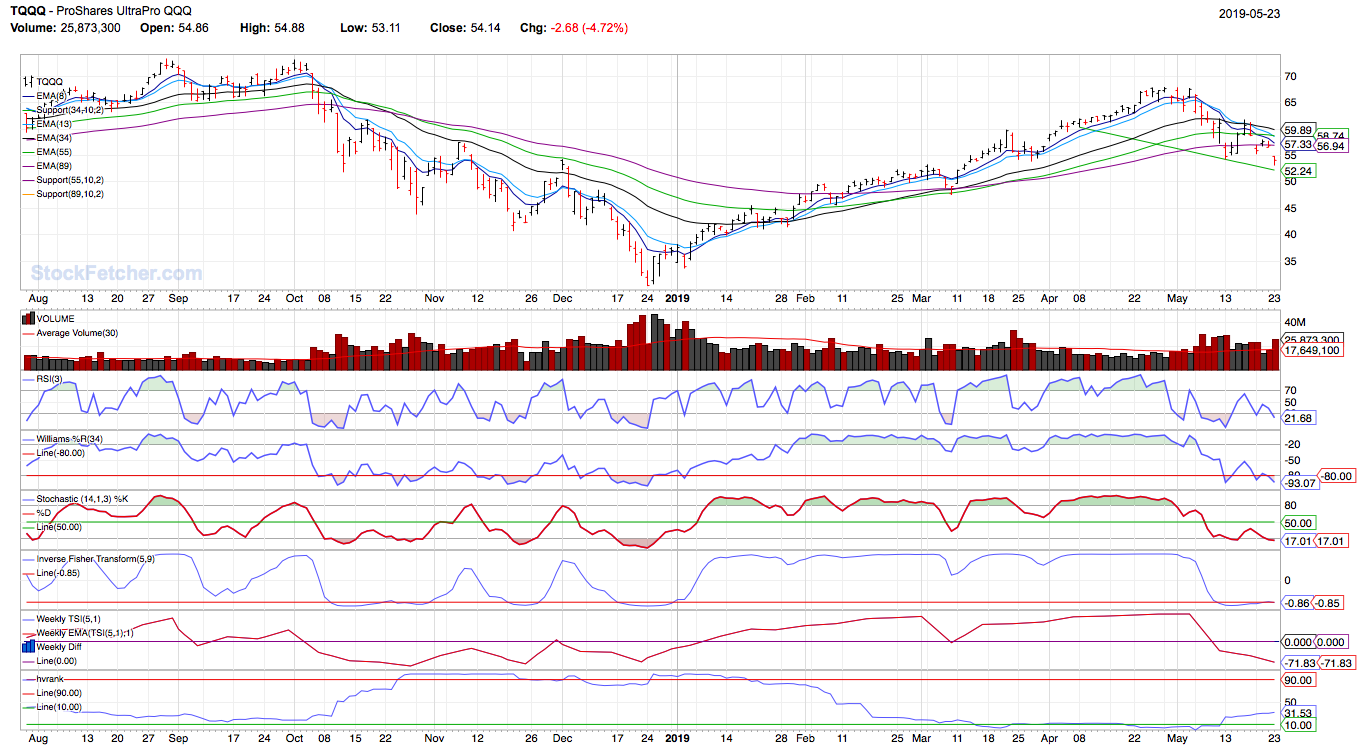 But what do i know...this is like trying to understand my 3rd wife! |
| sandjco 648 posts msg #147923 - Ignore sandjco modified |
5/25/2019 12:17:43 PM First time this showed up in a while...trend change or a warning that the trend is about to change? 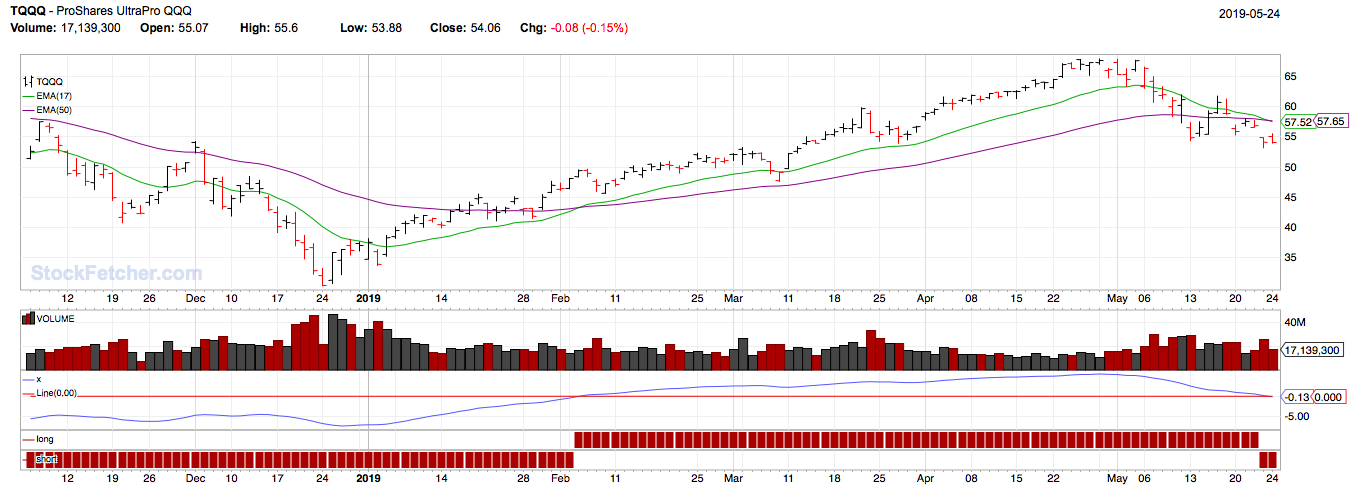 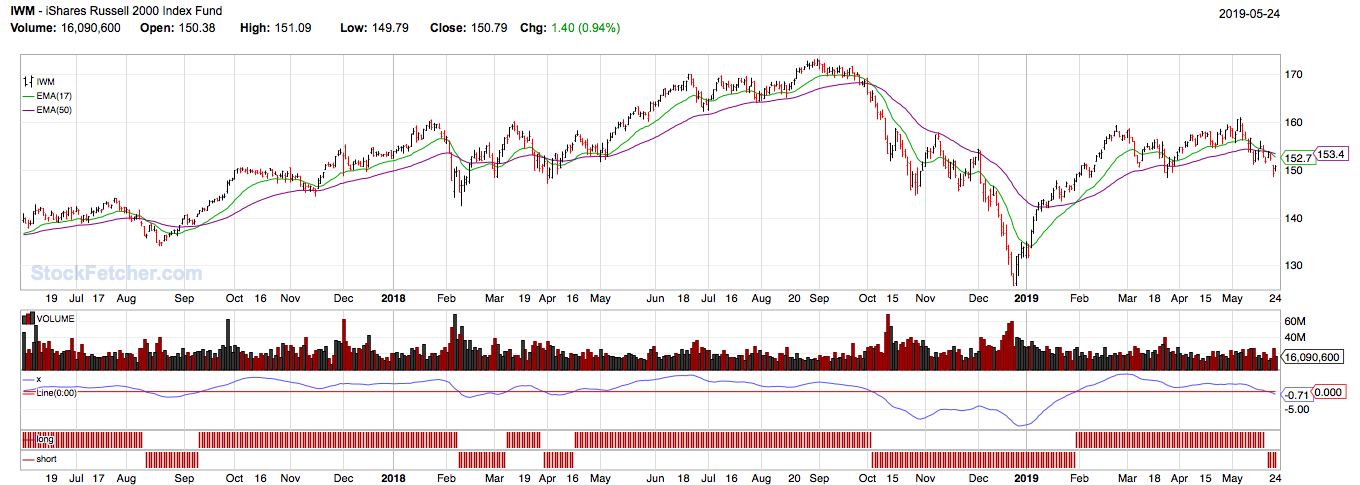 QQQ Jan 17 2020 175P $9.25 SPY Jun 14 2019 277P $2.10 Will use 50% stop Or will these puppies bounce? Nothing exciting to look forward to as most of the big wigs earnings are out. Only 2 visible drama left are Tariffs and Brexit. Resolution of Tariffs will most likely provide the next inflection point. Was gonna go short on this one...but decided to wait. 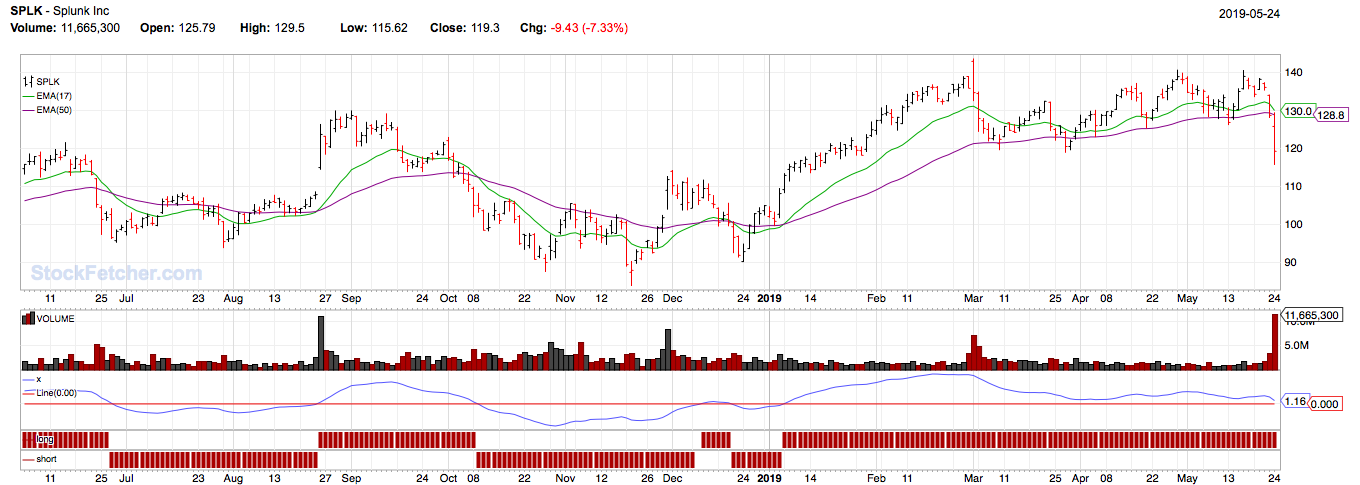 |
| StockFetcher Forums · Stock Picks and Trading · A Newbie's Journey | << 1 ... 38 39 40 41 42 ... 48 >>Post Follow-up |